
Announcing Poll Everywhere’s latest — and tastiest — response chart: donut.
Donut charts have joined Poll Everywhere’s growing lineup of response visualizations, including bar charts, live word clouds, and more.
Together, Poll Everywhere’s growing suite of visual settings ensures you have the right tools to engage any audience.
Donut charts are available now for all presenters. Read on to learn how to create your own.
How to create a Poll Everywhere donut chart
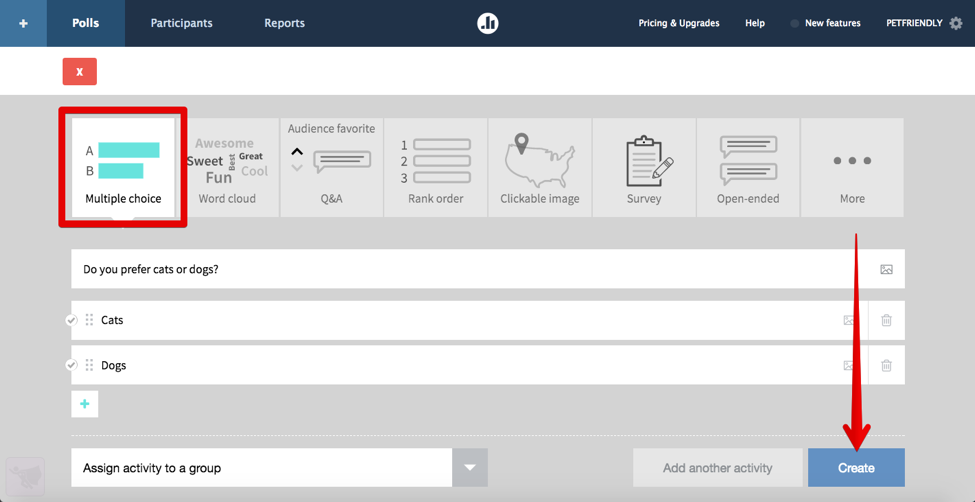
First, let’s head over to My Polls. Choose ‘Create’ in the top left corner. Enter a new multiple-choice question and responses, then hit ‘Create’ in the bottom right. This will take you to a screen showing the poll activity you just created.
Now you should see an empty, multiple-choice poll chart. From here, select the paintbrush icon to the right of your chart to open the visual settings menu. There are icons for ‘Bar chart’, ‘Column chart’, and ‘Donut chart’ at the top of this menu. Select ‘Donut chart’ to change the look of your response chart from bar to donut.
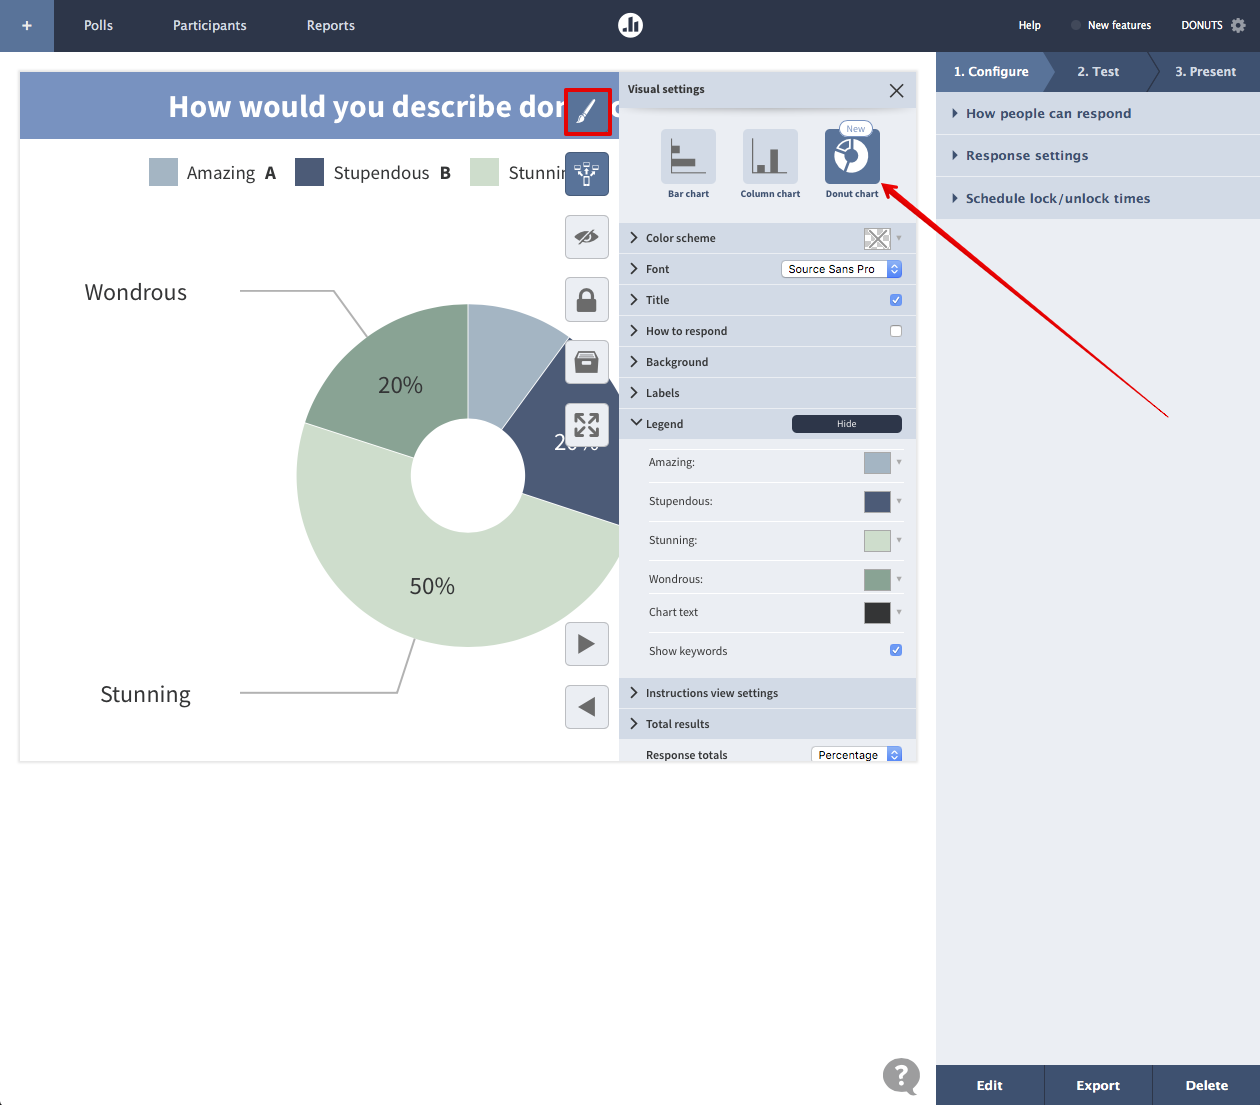
By default, your donut chart will appear as a black-and-white ring listing your response options. It looks this way because no one has responded to your activity yet. Let’s fix that by clicking on ‘2. Test’ in the column on the right. Activate your poll, and then choose a response. Your donut chart will animate automatically to reflect your selection.
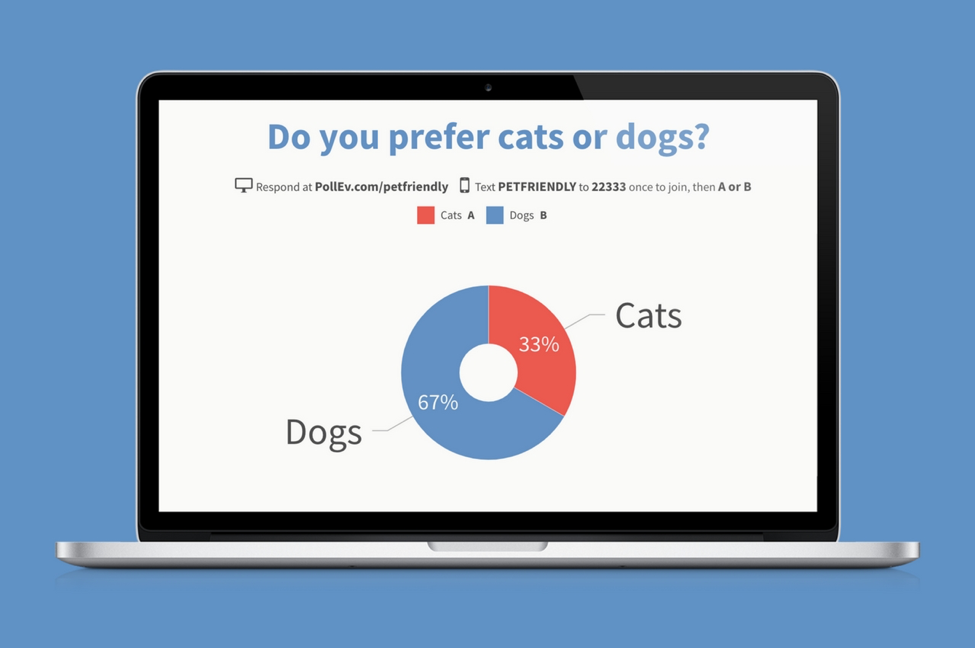
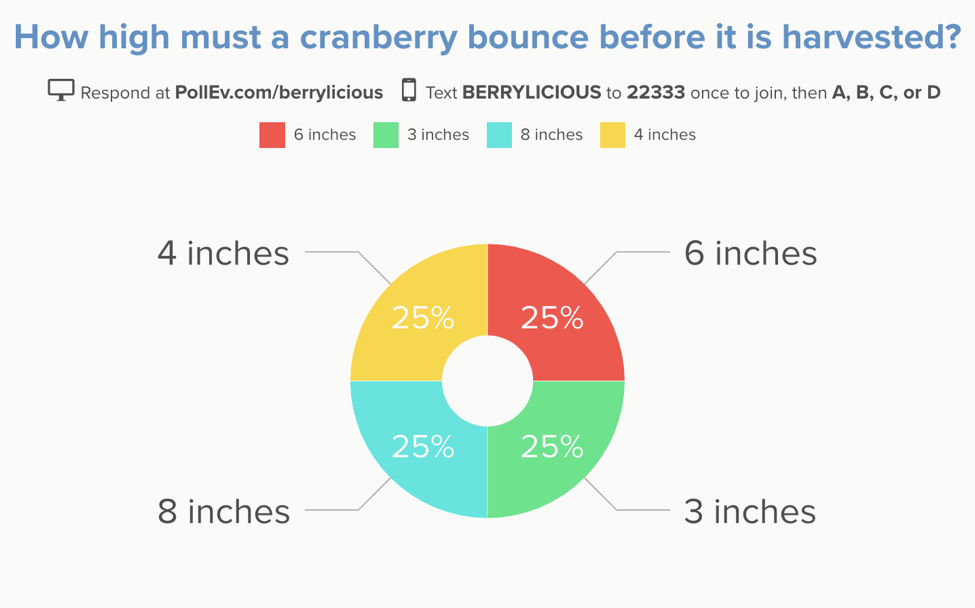
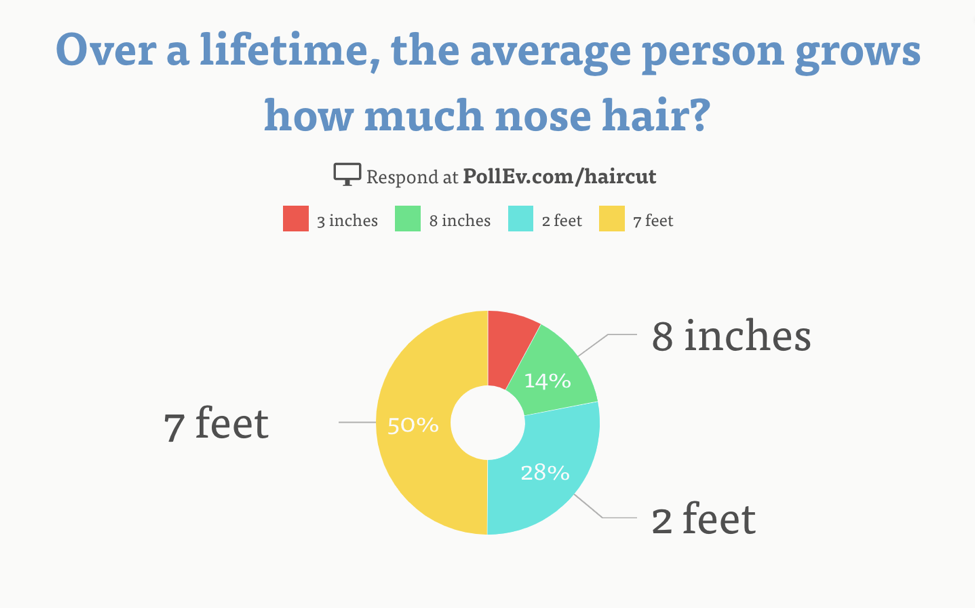
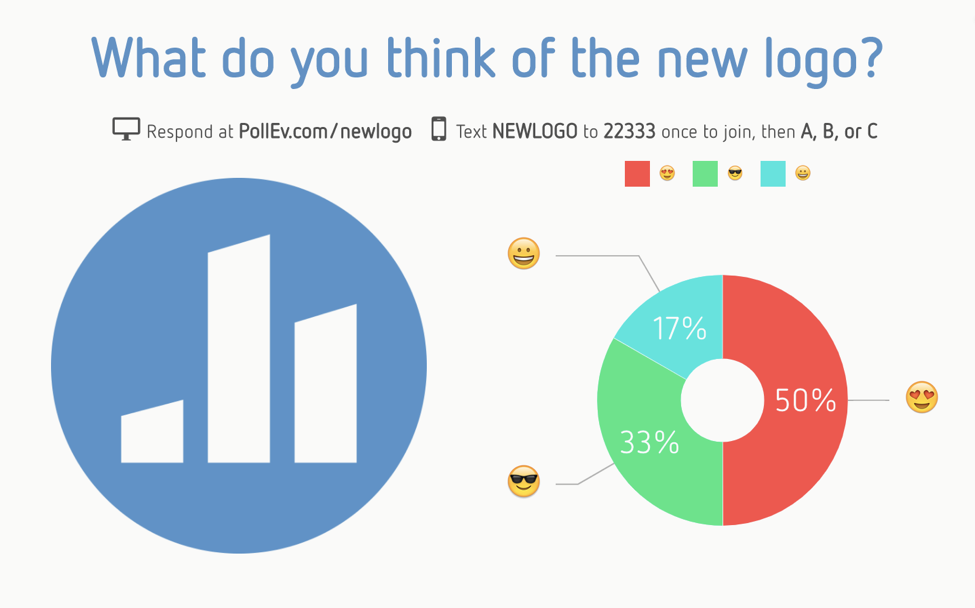
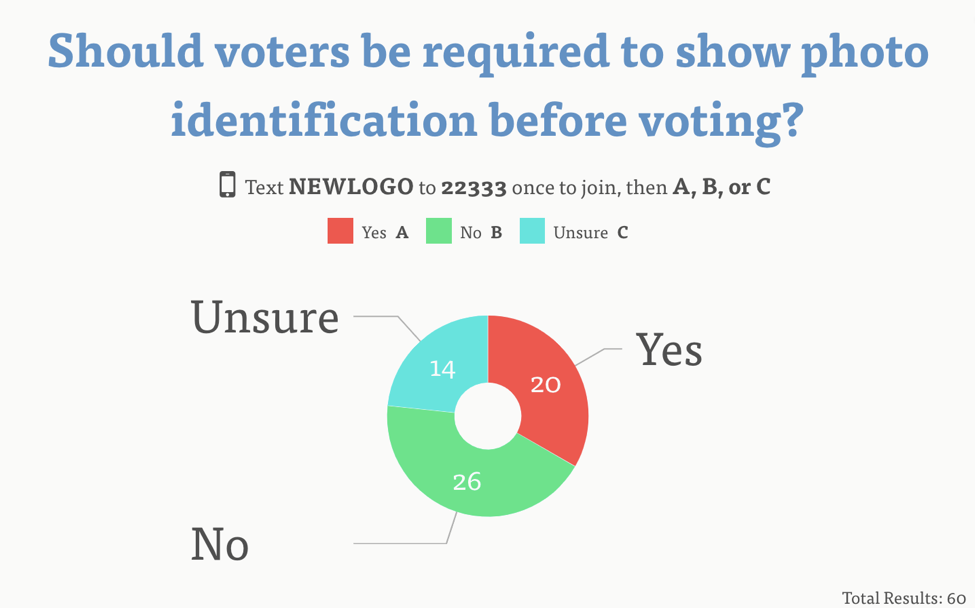
How will you use donut charts in your presentation?
There are lots of ways to use these new donut charts in questions. Here are a few examples to get you started. Be sure to share your own donut charts with @PollEverywhere on Twitter. We love seeing your creativity on display.
Want more inspiration? Poll Everywhere COO Sam Cauthen shares her strategy for presenting data in a presentation. I also have a full breakdown of a simple memory game you can deploy at any large meeting to help attendees remember more of what they hear.
Happy polling!