Empowering students with real data

- Location
- New York
- Size
- 10+
- Use case
- k12
"Poll Everywhere activities can be used as icebreakers but they also allow you to get into a deeper conversation. During these times, and always, we want our students to have more than a ‘yes’ or ‘no’ or ‘I don’t know’ answer."
Andrea E. Oliver, doctoral candidate at the CUNY Graduate Center and Program Manager at Girls Inc. of New York City, brings in real-time classroom data to foster meaningful conversations with her students. “With a few simple clicks and a couple of questions, I can get into more than just the quantitative information and more of the qualitative, rich discussions.”
Giving students a voice
Andrea is an educator focusing on teaching high school girls data analytics skills. “Generation Giga Girls is the first of its kind in the nation. It’s been around for six years and I’ve been part of the founding group. It’s part of a partnership with Girls Inc. and the Moody’s Foundation.”
She first found out about Poll Everywhere four years ago at an event hosted by the American Museum of Natural History. “The speaker was discussing skin — the importance of skin color and the evolutionary processes behind it. Throughout her talk, she ran live Poll Everywhere activities with us and we could respond on our phones. I was just wowed by it. It was awesome because we could give immediate feedback about what we were discussing. I spoke to her afterwards because I was excited about the tool and she said that she immediately knew what was going on in the audience and could speak to it right away. I thought ‘Yes, that’s the power I want to have in my classroom.’ I created my account that same night.”
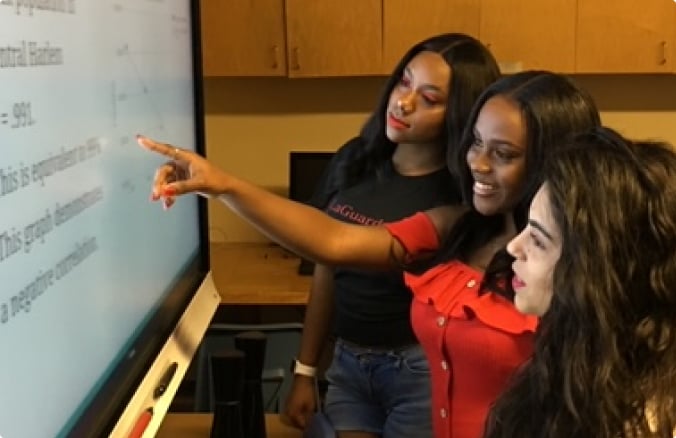
From that day, Andrea has been presenting activities in her classes to collect data and showing students how to work with it too. One of the first lessons where she incorporated Poll Everywhere was on the differences between quantitative and qualitative data. “I asked the students for their favorite artists and they narrowed them down to Meek Mill and Drake. Then, they took a vote on which one’s better with a multiple choice activity. Drake won with 77% of the responses. We then discussed how that result was based on quantitative data, or the numbers. Like an expert, one girl chimed in and suggested we ask why the class chose him. We discussed the qualitative aspects of his work and decided that maybe these two artists shouldn't be even in the same category because their music style is so different. After that, the students wanted to create their own questions and post them on the SMART Board so the entire class created Poll Everywhere accounts.”
Because she empowered students to collect their own data, Andrea can use their individual activities to power discussions. “If I’m interested in finding out some information or data, the girls instantly chime in with their questions and I’ll present them to the class.”
Measuring changes in sentiment
Andrea has also used open-ended questions to back the numbers with longer form responses. “In one of the units I created called ‘Is GPA Fair?’ the girls come in with their preconceived notions. I start off by asking that question first with a binary yes or no and then with an open-ended activity to collect both quantitative and qualitative data. It's beautiful when the lights are dimmed and their quotes come up on the SMART board. It becomes a powerful moment because I’m being driven by the data that I’m collecting in the classroom to have my next conversation.”
Seeing the change in overall sentiment after the unit has run its course is an impactful indicator of learning. “At the end of the unit, which is usually two weeks, I’ll ask the students again if they think GPA is fair. By this time, the responses change tremendously. I’ll display the results side by side with a split screen and they can compare the differences between their prior and newfound knowledge about GPA. They understand that it’s not just some random number, but a mathematical calculation which is important to keep up. That informal assessment allows them to summarize and justify what they think. I show those results to the principal as a way to demonstrate their learning of the calculation and grading systems behind GPA.”
Transitioning to distance learning
Since transitioning her classes to fully virtual, Andrea has adjusted her strategy for live interaction. “I would usually create Poll Everywhere activities as we go along but I’m now intentionally planning them in my lessons, particularly since we went virtual. Students need to have an activity to engage and interact with as they’re joining the online meeting.”
Based on students’ responses, Andrea has turned light-hearted icebreaker questions into deeper conversations. “I usually start off with simple questions like ‘How are you doing on a scale of one to five?’ After a few days, the girls started challenging me by requesting questions about the state of the world. Since they wanted to talk about COVID-19, they looked at different races and ethnicities in the United States and saw the major disparity affecting African American people and people of color. With an open-ended question, we had a discussion about what we thought was happening. By just showing a picture of the data and asking what they saw, we could talk about the reasons for the disparity like access to healthcare or fear of seeking medical help because of systemic issues.”
At the end of the day, Andrea’s students are learning to think critically and apply their data analytics skills to real-life issues.
"I’m trying to inform them. Data gives us evidence, depending on who’s collecting it, and we can then make observations based on the trends we see. From the discussions on COVID-19 came questions about the differences in the time it takes for Amazon deliveries of essential versus non-essential items. Then it became Black Lives Matter. Now, the whole political arena is coming into play. Throughout these discussions, Poll Everywhere is definitely embedded in my curriculum."
Bringing it full circle
Creating a flexible learning environment for students is also very important to Andrea. “As I’ve transitioned to the new normal, I’ve embedded activities in my Google Slides decks more often than before so I can refer back to them, highlight them, and discuss further. I can compare the girls’ responses to the national or international trends and see the similarities and differences in the data. We can then talk about why that occurred. Afterwards, I record the lesson so students can see what the results look like even if they weren’t in class that day.”
Recently, Andrea’s experience with Poll Everywhere came full circle during the annual capstone project. “One of my students used Poll Everywhere with a large audience. She was able to take that data right then, just like how I first experienced it with the speaker at the Museum of Natural History, and use it as a tool to teach and direct her presentation. It was just incredible.”
Looking ahead, Andrea is looking at new ways to incorporate Poll Everywhere into her classes using Competitions for a more gamified learning experience and Surveys to get honest feedback from the students. “I’m training my colleagues how to use Poll Everywhere as an exit ticket. Within five minutes, students can take the survey on their phones and you get a plethora of information not just about the class itself, but where you can improve, what they retained, and where to go next. I think that will be a valuable resource for educators and facilitators in our program.”
"The anonymity through Poll Everywhere gives students the ability to jump right in, even if they might not have answered a question otherwise. We need to have more time and space for classroom discussions."
Poll Everywhere in the classroom
Power your class discussions with meaningful student engagement.