From high-level reporting overviews to detailed insights
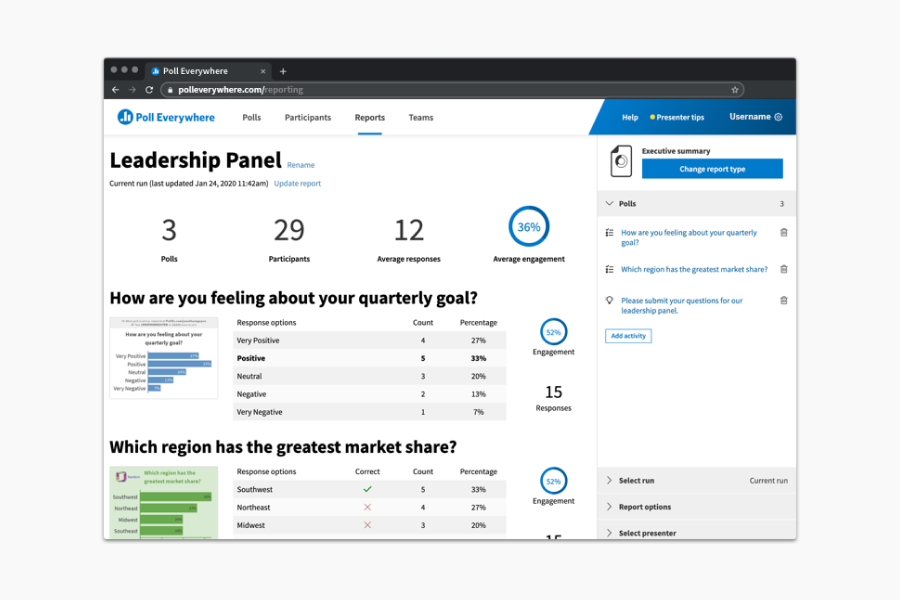
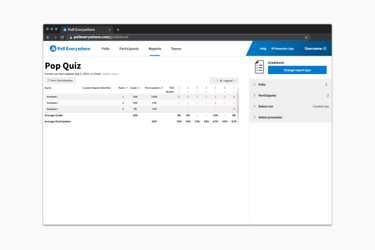
Reporting compiles audience response data after any activity and reveals useful insights to the presenter. Reports share the number of polls, participants, average responses, and average engagement.
Report types include:
• Executive summary
• Pivot table
• Participant response history
• Gradebook
Export your data as a CSV file to create your own custom reports.
Gauge understanding with auto-graded responses and reports
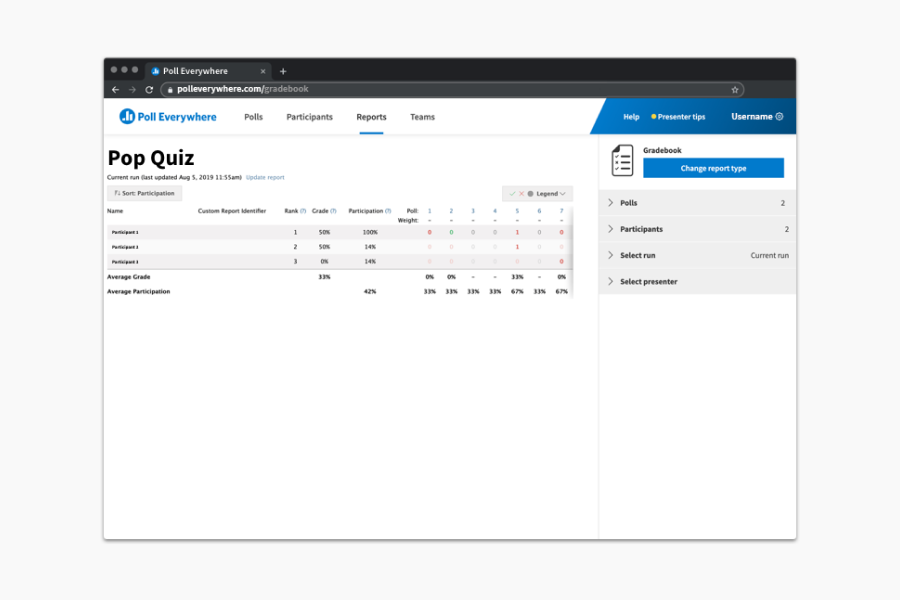
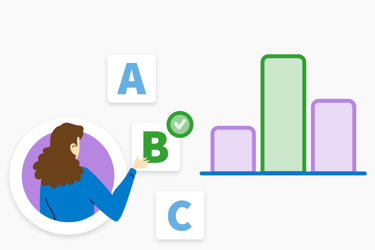
Assess knowledge with grading. Mark one or more of your response options on a multiple choice question or clickable image as correct and see the responses roll in. The correct answer will remain hidden until the poll is locked and you reveal the answer.
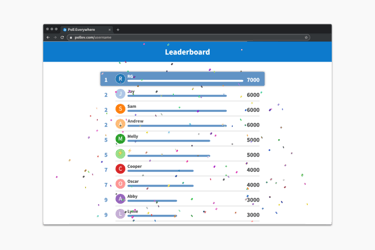
After the session, see how your class performed. A downloadable gradebook report shows all graded responses, a ranking of top-performing participants, and the average response time. Contact sales for more information on how to import the gradebook report to your school’s learning management system (LMS).
Learning management system (LMS)
Import student roster
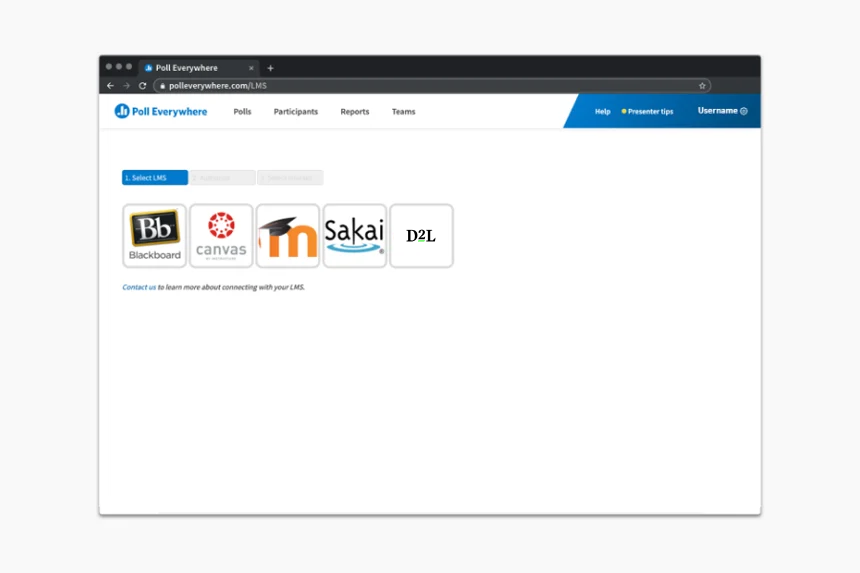
Register your students as participants by importing your student roster from your LMS to Poll Everywhere. This creates a participant account for every student, eliminating student self-registration.
Export grades
Transfer a gradebook report directly into your LMS with student attendance, participation scores, and graded questions.
Asynchronous feedback
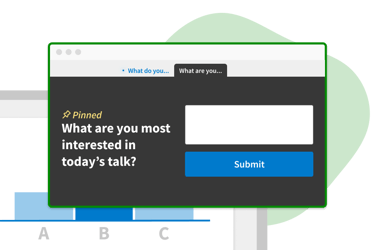
Hear from everyone with real-time feedback
Before you present
Set up for an engaging classroom
During your presentation
Spark compelling conversations in real-time
After you present
Gain actionable insights that better student results
-
-
-
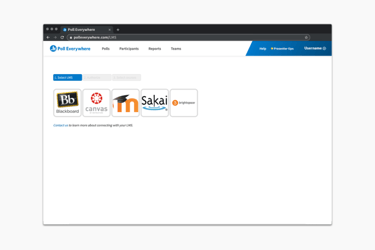
Integrate your university or department-wide account with your learning management system (LMS)
learning management system
Learn More

.png?height=250&name=team-collab-features-img-router-8f94c47460326fd4685cf0d9163b0c285bf209d0215e3133b3043d80833d51b1%20(1).png)
