Column chart
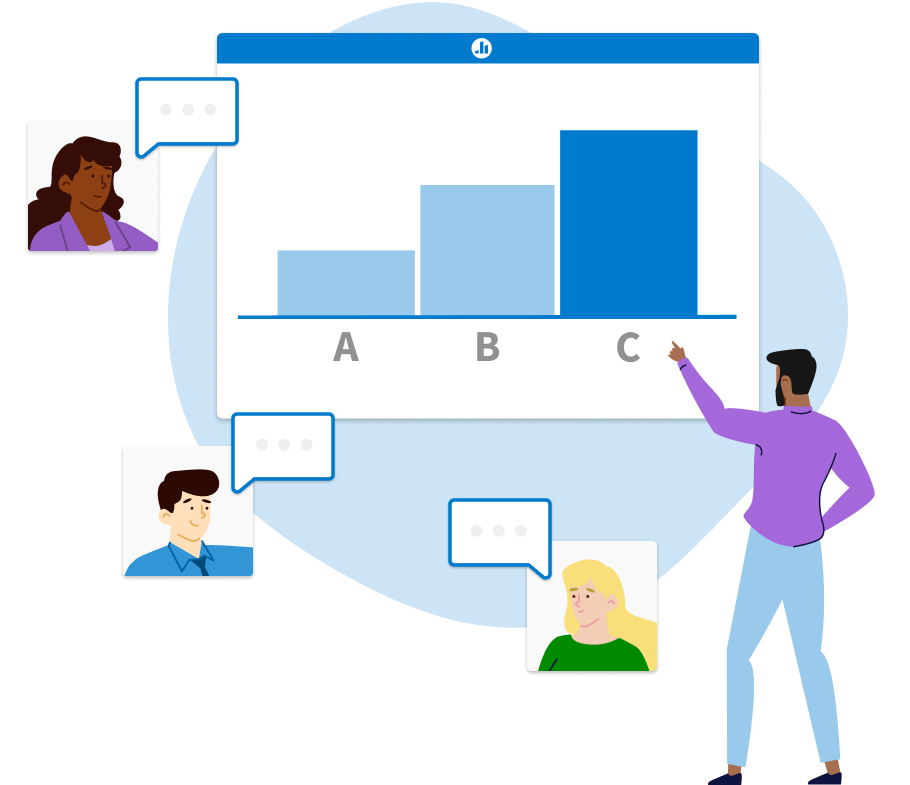
Compare responses side-by-side in a classic column chart
More types of activities

Project feedback
Gather feedback on a project and prioritize the most relevant entries so you can address what matters.


Medical case discussion
Using an X-ray as a clickable image, ask participants to identify the affected area of the body after a case study.